

The Kumtor Mine is a world-class orogenic gold system in the Kyrgyz Republic, with four gold deposits and a processing plant operating at 4,016 m elevation.
Report context
This technical report summarizes the current and planned operations, Mineral Resources and Mineral Reserves for the Kumtor Mine, Kyrgyz Republic, with an effective date of July 1, 2020, and a report date of February 24, 2021. The report was prepared for Centerra Gold Inc. and conforms to National Instrument 43-101 Standards of Disclosure for Mineral Projects. It provides an update of the 2015 Technical Report and includes a major upgrade in the understanding of the geologic model, a resource model update based on extensive in-fill and expansion drilling in recent years, updated gold price assumption, pit slope angles, capital and operating cost estimates, and metallurgical recovery estimates based on process plant improvements.
Processing route
Process description
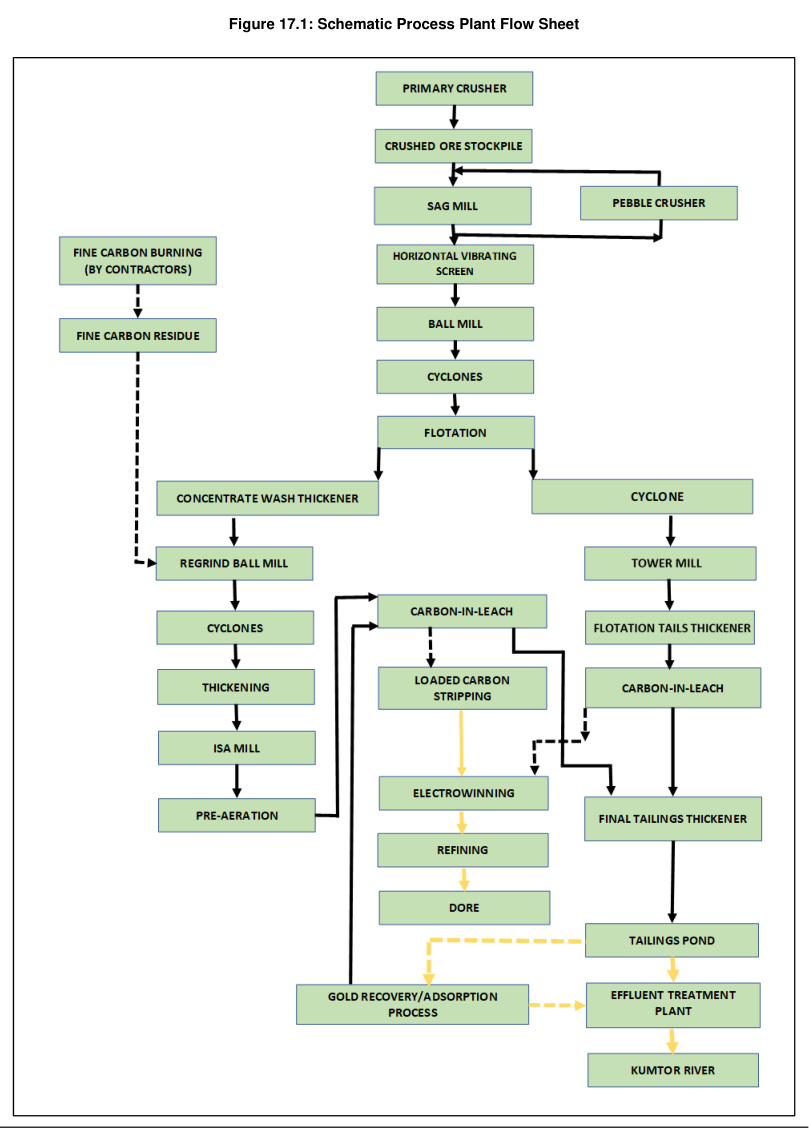
The processing plant operates using a conventional flowsheet. A schematic process plant flow sheet is presented in the report as Figure 17.1. The process description is provided in Section 17.2 of the report.
Metallurgical testing
Historical metallurgical testing is described in Section 13.3 of the report.
Metallurgical testing in support of the 2020 Technical Report is described in Section 13.4. This testing included work to support process upgrades, as described in Section 13.10, which discusses metallurgical tests to support process upgrades.
Metallurgical recovery models
The report presents metallurgical recovery models for several ore zones:
Stockwork Zone: A recovery curve for the Central Pit Stockwork Zone is shown in Figure 13.1.
Hockey Stick Zone: A recovery curve for the Central Pit Hockey Stick Zone is shown in Figure 13.2.
SB Zone: A recovery curve for the Central Pit SB Zone is shown in Figure 13.3.
Sarytor/Southwest: A metallurgical recovery model for Southwest-Sarytor is shown in Figure 13.4.
Historical process plant performance
Historical gold recovery as a function of head grade is presented for several periods:
- Stockwork Zone gold recovery as a function of head grade from 1998 to 2006 (Figure 13.5)
- SB Zone gold recovery as a function of head grade from 2008 to 2014 (Figure 13.6)
- Stockwork and SB Zone gold recovery as a function of head grade from 2015 to 2020 (Figure 13.7)
Testwork on regrind and extended leaching
KGC summary results on the impact of regrind and extended leaching on flotation tailings recovery are presented in Table 13.2.
SGS test results on the impact of extended leach and regrind on recovery from flotation tailings are presented in Tables 13.3 and 13.4.
KGC results summarizing the impact of regrind on recovery from specific ore zones are presented in Table 13.5.
Process plant recoveries
Process plant recoveries are discussed in Section 13.9. Life-of-mine (LOM) recoveries expected are presented in Table 13.6.
Annual tonnage processed
Annual tonnage processed from 1997 through 2019 is shown in Figure 13.9.
Processing costs
Estimated processing costs by category are presented in Table 21.6, and estimated processing costs by activity are presented in Table 21.7. Processing operating costs are discussed in Section 21.5.
Key reported parameters
| Parameter | Value | Basis |
|---|---|---|
| Mill recovery (historical, 1997-2019) | 79.0% | Actual |
| Gold produced (historical, 1997-2019) | 12,642,000 oz | Actual |
| Ore milled (historical, 1997-2019) | 129,017,000 tonnes | Actual |
| Average mill head grade (historical) | 3.9 g/t | Actual |
| Process plant elevation | 4,016 m | Design |
| LOM processing schedule | Table 22.1 | Proposed |
| LOM recoveries expected | Table 13.6 | Proposed |
| Process plant flow sheet | Figure 17.1 | Design |
| Stockwork Zone recovery curve | Figure 13.1 | Proposed |
| Hockey Stick Zone recovery curve | Figure 13.2 | Proposed |
| SB Zone recovery curve | Figure 13.3 | Proposed |
| Southwest-Sarytor recovery model | Figure 13.4 | Proposed |
| Regrind impact on flotation tailings recovery | Table 13.2 | Testwork |
| SGS test results – extended leach and regrind | Tables 13.3, 13.4 | Testwork |
| Regrind impact by ore zone | Table 13.5 | Testwork |
| Annual tonnage processed (1997-2019) | Figure 13.9 | Actual |
| Stockwork Zone recovery vs. head grade (1998-2006) | Figure 13.5 | Actual |
| SB Zone recovery vs. head grade (2008-2014) | Figure 13.6 | Actual |
| Stockwork and SB Zone recovery vs. head grade (2015-2020) | Figure 13.7 | Actual |
| Processing operating costs | Section 21.5 | Proposed |
Project website: https://www.mining.com/centerra-gold-hands-kumtor-mine-to-kyrgyzstan-ending-dispute/
Project website: https://en.wikipedia.org/wiki/Centerra_Gold
Technical qualifications
This technical report was prepared by Qualified Persons for Centerra Gold Inc. and conforms to National Instrument 43-101 Standards of Disclosure for Mineral Projects. The report follows the format set out in Form 43-101F1 for Technical Reports. The report is based on information available as of the effective date of July 1, 2020, and the report date of February 24, 2021.
All dollar figures in this technical report refer to United States Dollars, unless otherwise noted.
Source: "Technical Report on the Kumtor Mine, Kyrgyz Republic," NI 43-101 Technical Report, effective date July 1, 2020, report date February 24, 2021, Sections 1, 13, 17, and 21.
