

This technical report updates mineral resources, mineral reserves, capital and operating cost estimates, and the financial estimate for the Palmarejo Complex as of August 31, 2015.
Report context
The technical report for the Palmarejo Complex was prepared with an effective date of August 31, 2015 and a report date of November 2, 2015. The Palmarejo Complex is located approximately 420 kilometres by road southwest of the city of Chihuahua, in the state of Chihuahua, Mexico, on the western edge of the Sierra Madre Occidental mountain range in the Temoris and Guazapares mining district. The complex consists of: (1) the Palmarejo open pit and underground mine and mill complex; (2) the Guadalupe deposit, located about 8 kilometres southeast of the Palmarejo mine; (3) the Independencia deposit, located northeast of the Guadalupe deposit; and other deposits and exploration targets. The complex covers 54,685.4 hectares under mining concessions. The purpose of the report is to disclose mineral reserves for the Independencia deposit following acquisition of the San Miguel Project from Paramount Gold and Silver Corp on April 17, 2015, to update mineral resources and mineral reserves for the Guadalupe deposit, to update mineral reserves for the Palmarejo deposit, and to update capital and operating cost estimates and the financial estimate for the Palmarejo Complex. All currency is expressed in U.S. dollars unless otherwise noted.
Processing route
Introduction to the processing facility
The Palmarejo mill processes ore from the Palmarejo open pit and underground mines, the Guadalupe underground mine, and the Independencia underground mine. The processing facility is part of the Palmarejo Complex infrastructure that also provides tailings and administrative support.
Crushing and grinding
The process begins with crushing followed by grinding.
Flotation
The flotation circuit produces a flotation concentrate. The Palmarejo Flotation Circuit Flow diagram is referenced in the report as Figure 17.1.
Flotation concentrate leaching
The flotation concentrate undergoes leaching.
Flotation tailings leaching
The flotation tailings also undergo leaching.
Carbon desorption and carbon regeneration
The process includes carbon desorption and carbon regeneration.
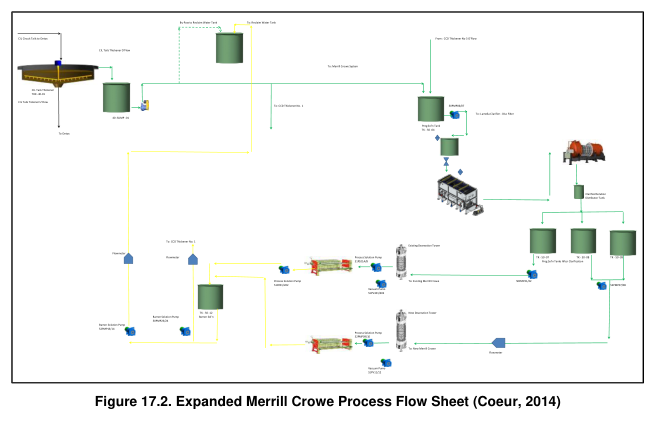
Merrill Crowe and smelting
An expanded Merrill Crowe process is used, as shown in Figure 17.2 of the report. The process concludes with smelting to produce doré.
Cyanide detoxification
Cyanide detoxification is conducted as part of the process.
The overall process flow sheet for the Palmarejo Complex is presented as Figure 17.3 in the report. The report notes that the process flow sheet represents the design as of 2015.
Key reported parameters
The following table summarises the key reported parameters from the technical report. The basis for each parameter is identified as design, historical operating data, or testwork as stated in the report.
| Parameter | Unit | Value | Basis |
|---|---|---|---|
| Silver price (short-term 2015-2017) | $/oz | 15.50 | Assumption used in economic analysis |
| Silver price (long-term 2018+) | $/oz | 17.50 | Assumption used in economic analysis |
| Gold price (short-term 2015-2017) | $/oz | 1,150 | Assumption used in economic analysis |
| Gold price (longterm2018+) | $/oz | 1,250 | Assumption used in economic analysis |
| Metallurgical recovery gold (205-206) | % | 87.0 | Based on actual process plant results, metallurgical test work, and reasonable assumptions |
| Metallurgical recovery gold (207-2022) | % | 90.0 | Based on actual process plant results, metallurgical test work, and reasonable assumptions |
| Metallurgical recovery silver (205-206) | % | 85.0 | Based on actual process plant results, metallurgical test work, and reasonable assumptions |
| Metallurgical recovery silver (207-2022) | % | 87.0 | Based on actual process plant results, metallurgical test work, and reasonable assumptions |
| Proven mineral reserve silver grade | g/t | 216 | Based on mine design and cut-off grade analysis |
| Proven mineral reserve gold grade | g/t | 2.65 | Based on mine design and cut-off grade analysis |
| Probable mineral reserve silver grade | g/t | 164 | Based on mine design and cut-off grade analysis |
| Probable mineral reserve gold grade | g/t | 2.56 | Based on mine design and cut-off grade analysis |
| Measured mineral resource silver grade | g/t | 166 | Based on resource estimation methodology |
| Measured mineral resource gold grade | g/t | 1.75 | Based on resource estimation methodology |
| Indicated mineral resource silver grade | g/t | 153 | Based on resource estimation methodology |
| Indicated mineral resource gold grade | g/t | 2.19 | Based on resource estimation methodology |
| Mill throughput total ore processed | k-tonnes | 8,567 | Mine plan basis |
| Open pit mining cost | $M | 20 | Based on previous actuals and life of mine budgeted costs |
| Underground mining cost | $M | 399 | Based on previous actuals and life of mine budgeted costs |
| Milling/processing cost | $M | 250 | Based on previous actuals and life of mine budgeted costs |
| Smelting and refining cost | $M | 20 | Based on recent actual data |
| General and administration cost | $M | 127 | Based on previous actuals and life of mine budgeted costs |
| Corporate management fee | $M | 27 | Based on previous actuals and life of mine budgeted costs |
Technical qualifications
The report contains cautionary statements regarding forward-looking information. The mineral resource estimates use the terms "Measured Mineral Resource", "Indicated Mineral Resource" and "Inferred Mineral Resource" as defined under Canadian Institute of Mining, Metallurgy and Petroleum (CIM) Standards on Mineral Resources and Mineral Reserves. These terms are recognized and required by Canadian securities regulations but are not defined terms under standards of the United States Securities and Exchange Commission. Under United States standards, mineralization may not be classified as a "Reserve" unless the determination has been made that the mineralization could be economically and legally produced or extracted at the time the Reserve calculation is made. Mineral resources are reported exclusive of mineral reserves and have not demonstrated economic viability. Inferred mineral resources have a lower level of confidence than Indicated mineral resources and it is expected that some could be upgraded with continued exploration.
The report also notes that for the Guadalupe and Independencia deposits, the mine plan was evaluated using two sets of prices: short-term prices for 2015 to 2017 of $15.50/oz silver and $1,150/oz gold, and long-term prices for 2018 and beyond of $17.50/oz silver and $1,250/oz gold. The Palmarejo open pit and Palmarejo underground mineral reserves were estimated using only short-term prices since these deposits are expected to be mined out by the end of 2016.
Source: Technical Report for the Palmarejo Complex, SW Chihuahua State, Mexico, NI 43-101 Technical Report, effective date August 31, 2015, report date November 2, 2015, Sections 1, 13, 14, 15, 17, 21, 22, and cautionary notes.
